Start with a date, then find the stocks
When you pick a stock because you know it rallied, you begin with information you would not have had at the time.
You can study the chart. But you have already skipped the search.
A historical screen changes the starting point. Choose a past date, apply your filters, and review the stocks that met those conditions. The list can include stocks that later rallied, fell, or went nowhere.
Now you have a decision to make.
For example, you might look for stocks trading above their 200-day moving average and below their 20-day moving average. A moving average tracks the average closing price over a set number of trading days. These filters look for stocks above a longer-term average that have slipped below a shorter-term one.
That is a question to investigate. It does not establish a profitable strategy.
Open the results. Examine the declines. Look at nearby price levels. Decide which charts deserve more attention and which you would leave alone.
Write down your judgment before revealing the outcome
A past date only helps if the chart stops there, too.
If the next rally is already visible, you are judging the setup with the answer in front of you.
In TickerAtlas, charts opened from dated results end at the selected session. Later candles stay outside the view.
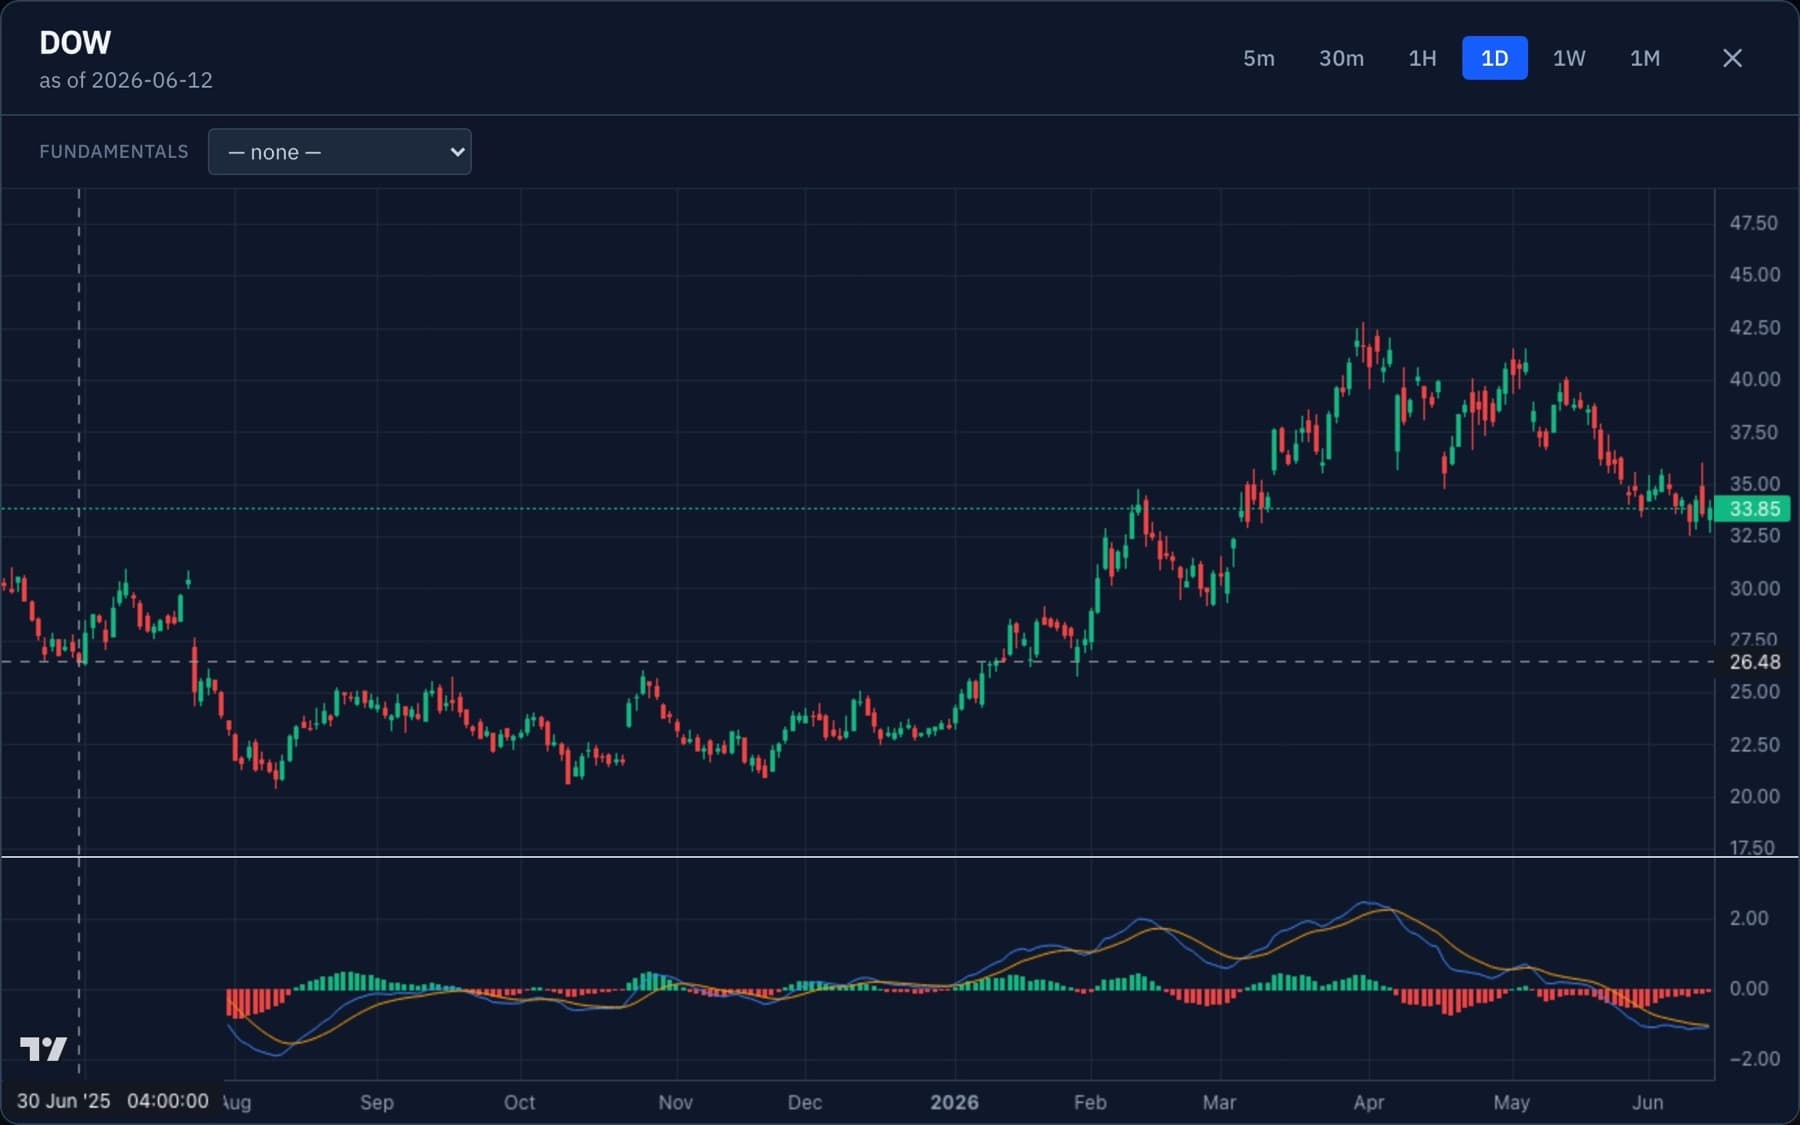
Before looking ahead, make a short note:
- What caught my attention?
- What would make me reject this setup?
- Would I put this stock on my watchlist?
Write down your hesitation as carefully as your interest. “I would pass” is a useful decision to preserve.
Then check later sessions in another charting tool. Compare what happened with what you actually wrote. Keep the charts you rejected in the review.
Your notes give you a record of the decision before the outcome could change your memory of it.
Build a review routine you can repeat
Choose one screening question. Keep the filters the same. Try another date.
A simple routine is enough:
- Choose a past session.
- Run the screen.
- Review candidates with later candles hidden.
- Record your judgment.
- Check what happened afterward.
Changing the filters after every disappointing result makes the exercise difficult to assess. Keeping them steady gives you comparable decisions to review.
Over several sessions, examine your notes. Did you apply the same criteria? Did you overlook reasons to pass? Did you become more enthusiastic only after seeing a rally?
These observations can guide further practice. They do not prove that your approach has an edge.
Practice with TickerAtlas
The Historical Screener lets you combine technical and fundamental filters, choose a past date, and review results as a list or chart cards. Open an individual chart when you want more context.
If you want to study a specific break-and-pullback setup, Aligned Retests is a separate preset scanner with its own past-date control. It looks for a break and return to a level while weekly and daily trends agree. Read more about those views in the multi-timeframe scanning guide.
Both tools support manual research. They do not automatically play future bars forward, execute trades, or calculate a strategy’s profitability.
There are limits to the historical view. Screens use a fixed stock list, so some companies that traded on your chosen date may be missing. Financial data may include later restatements. A dated screen cannot recreate everything that was known then.
Start with one date and one question. Before you reveal the next candle, leave a record of what you would have decided.