Start with the larger move
Every candle summarizes a period of trading. A weekly candle covers a week. A daily candle covers a day. A four-hour candle shows a smaller piece of the history.
Changing the timeframe changes what catches your attention.
A week of falling prices may dominate the daily chart. On the weekly chart, that decline may look like a small pause within a longer rise. On an hourly chart, a brief bounce may look convincing while the daily decline continues.
Consider two stocks.
The first has made higher peaks and higher lows for several months. It pulls back toward a level it recently broke above.
The second has been falling for months. It bounces for a day.
Both are moving up on a short chart. The larger view gives you a reason to examine them differently.
Before studying the smaller move, describe the larger one.
Give the shorter chart a specific question
Once you understand the surrounding move, use the shorter chart to examine a detail.
Is price returning to a previous level? Has momentum started to recover? Has the stock already moved far beyond the area you wanted to study?
Decide what you want to know before changing the chart period. Otherwise, it is easy to keep switching views until you find one that looks encouraging.
A useful review should end with a sentence you can explain:
“This stock has been rising for months and is now returning to a level it recently broke above.”
That sentence gives your search a purpose.
Use a scanner to find candidates
Repeating this process across a stock list takes time. A multi-timeframe stock scanner applies defined conditions and returns the names that match.
TickerAtlas presents matches as chart cards, with the price chart and the reason for the match together.
Different scanners ask different questions.
Aligned Retests, a preset in the Confluence tool, looks for a break and return to a level while weekly and daily trends agree. You choose the shorter chart period for the setup.
Pullback Turn looks for daily momentum easing while momentum on a shorter chart begins to recover. It uses MACD, a price-momentum indicator, to compare those changes.
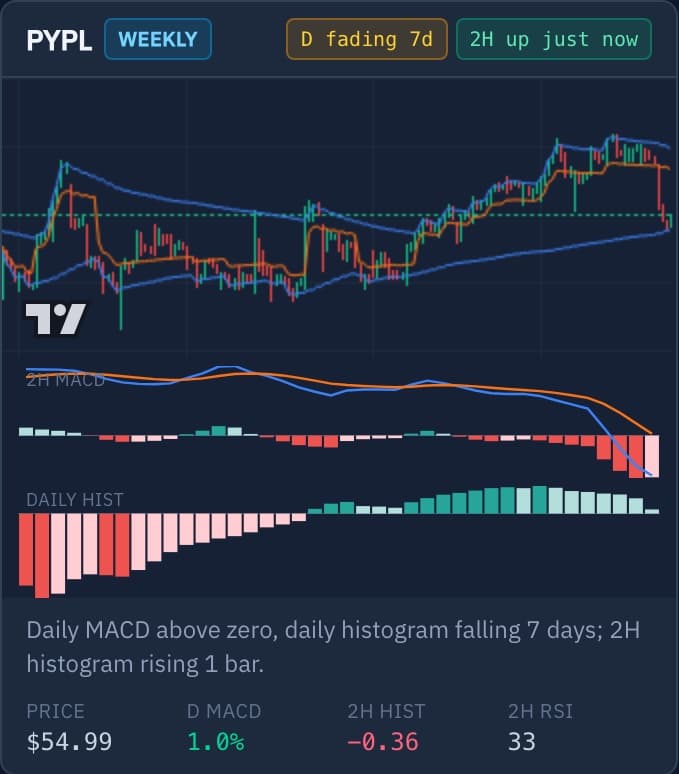
In this example, the daily momentum reading has faded for seven days. The two-hour reading has started rising, but remains below zero.
Both facts matter. Recovering momentum alone does not establish a complete price reversal.
Make the review repeatable
Before running a scan, write down the relationship you want to study.
Then follow the same sequence:
- Describe the larger move.
- Examine the setup on the shorter chart.
- Check why the stock matched.
- Decide whether it deserves further review.
Agreement across timeframes does not establish a profitable trade. These views describe the same price history at different scales.
TickerAtlas uses delayed market data, and matches remain candidates for your judgment. You can also review a past date to practice before looking at later price action.
Start with one question. Give each chart a job. Stop when you have enough information to make your next decision.